The Short Answer
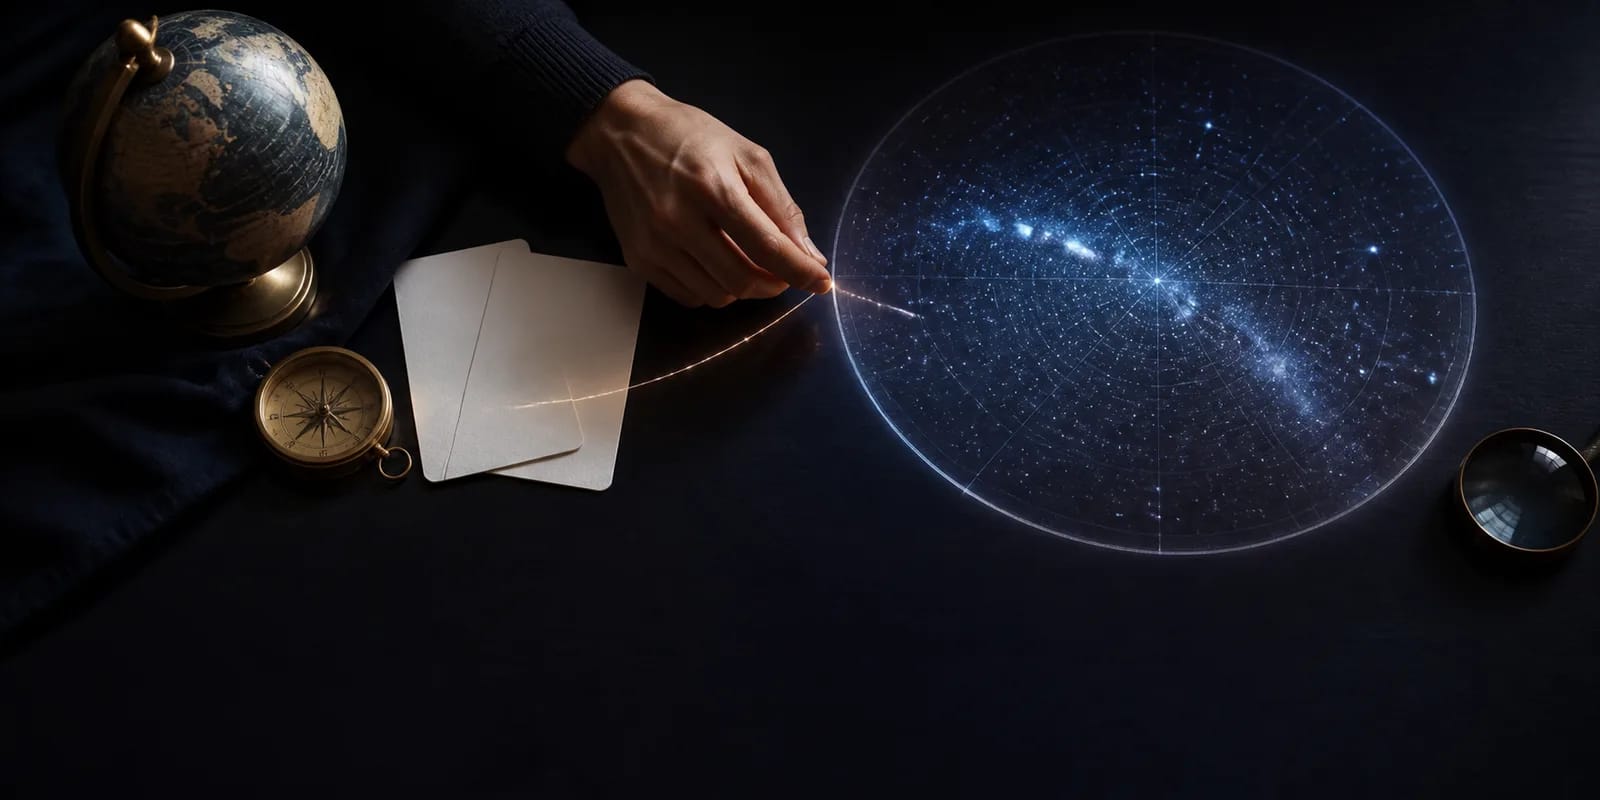
A personalized star map is generated through a seven-step pipeline that turns three user inputs — date, time, and GPS location — into a printable image of exactly which stars were above the horizon at that moment. The system calculates local sidereal time using the IAU 2006 algorithm, projects the celestial sphere onto a flat 2D disc using a stereographic projection, filters 8,921 stars from the HYG catalog v4.2 down to magnitude 6.5 (the naked-eye visibility limit), overlays the 88 IAU-recognized constellation line segments, applies one of eight aesthetic styles, and outputs a 300 DPI print-ready file at 4960×7016 pixels (A3 size). No artistic license is taken with star positions — every dot on the map corresponds to a real star that was genuinely overhead.
Why Anyone Should Care How It Works
A star map's value depends on whether the data behind it is real. A scientifically rendered star map means something verifiably different from a decorative print — that night, that place, those stars. The seven steps below describe exactly what happens between clicking "generate" and the moment a PDF lands in your inbox.
Step 1 — User Input
The user provides three things in the configurator:
- Date (year, month, day)
- Time (hour and minute, 24-hour)
- Location (a city or address, geocoded into latitude and longitude)
That's the entire astronomical input. Aesthetic choices (style, inscription) don't affect the calculation — only how the data is rendered.
The location is converted to decimal degrees (New York City: 40.7128°, −74.0060°). The time is converted to UTC using the historical time zone for that location, handling daylight saving correctly including pre-1970 rules.
Step 2 — Calculate Local Sidereal Time
The Earth rotates relative to the stars in about 23 hours 56 minutes — slightly faster than the 24-hour solar day. To know which stars are overhead, the system computes local sidereal time (LST), the right ascension currently transiting the local meridian.
OwnStarMap uses the IAU 2006 algorithm, the international astronomical standard:
- Compute the Julian Date from UTC
- Compute Greenwich Mean Sidereal Time using the IAU 2006/2000A precession-nutation model
- Add the observer's longitude (in time units) to get LST
For dates from 1900 to 2100, this is accurate to better than a tenth of a second of time.
Step 3 — Project the Celestial Sphere
The sky is a sphere; a printed page is flat. The system uses a stereographic projection centered on the user's location.
Stereographic projection preserves angles (constellation shapes stay correct) and maps small circles on the sphere to small circles on the plane (the visible sky becomes a clean disc). The horizon maps to the boundary of the disc; the zenith maps to the center.
Each star's celestial coordinates are converted to altitude and azimuth using the LST from step 2, then projected onto the disc. Stars below the horizon are discarded — they weren't visible.
Step 4 — Filter the Star Catalog
The system uses HYG v4.2, combining three foundational catalogs:
- Hipparcos (ESA satellite astrometry, 1989–1993)
- Yale Bright Star Catalog (traditional bright-star designations)
- Gliese (nearby stars including faint red dwarfs)
HYG v4.2 contains over 119,000 stars total. The pipeline filters to magnitude 6.5 (the naked-eye limit), leaving roughly 8,921 stars on a typical mid-latitude map after the horizon cut from step 3.
Each star's apparent magnitude determines how large and bright its rendered dot will be — Sirius and Vega become noticeable points; magnitude-5 stars become faint specks contributing to the texture of the sky.
Step 5 — Overlay Constellation Lines
The 88 IAU-recognized constellations are drawn as line segments connecting member stars. The IAU formalized the boundaries in 1930 (Eugène Delporte's work), and the line patterns today derive from those boundaries plus traditional figure conventions.
For each constellation visible above the horizon, the system loads the predefined line list, verifies both endpoints are above the horizon, draws the visible segments at low opacity, and labels the brightest named stars (Sirius, Betelgeuse, Polaris).
If part of a constellation has set, only the connecting lines that remain are drawn — you'll see truncated figures near the horizon, which is astronomically correct.
Step 6 — Apply Visual Style
The astronomical layer is complete: an accurate projection of every visible star, with constellation lines drawn. The visual style layer turns this scientific output into art.
OwnStarMap offers eight styles — Classic Navy, Midnight Black, Watercolor, Aurora, Vintage Map, Minimal White, Cosmic Pink, and Bohemian. Each defines colors, line weights, typography, and atmospheric effects.
The underlying star positions are identical across all eight styles. The science doesn't change, only the presentation.
Step 7 — Render to Print-Ready File
The final step is rasterization at print resolution.
For digital downloads, the output is a 4960×7016 pixel PNG or PDF at 300 DPI — the standard for fine-art printing at A3 (11.7×16.5 inch). This prints sharply up to 18×24 inches without visible pixelation.
For physical orders, the same vector data is sent to the print partner, who outputs on FSC-certified paper using archival inks. The 300 DPI threshold keeps the smallest features — magnitude-6 stars and fine constellation lines — crisp at arm's-length distance.
The whole pipeline runs in under 30 seconds on the server.
Verifying the Output
A useful sanity check anyone can run: compare a generated star map against a planetarium app (Stellarium, Sky Safari, Sky Guide) set to the same date, time, and location. The constellations should be in the same positions, the same brightest stars should be visible, and the same asterisms (Orion's Belt, the Big Dipper handle) should appear at the same orientation. If your generated star map matches a planetarium app, the data is real.
For a side-by-side accuracy summary of our data sources and algorithms, see our accuracy page.
FAQ
Why magnitude 6.5 as the cutoff?
That's roughly the faintest a star can be while still being visible to the naked human eye under perfectly dark conditions (Bortle 1 sky). Including stars fainter than that would add dots no one could ever have seen on the date in question.
Are planets shown on a star map?
Not by default. Planets move relative to the stellar background and their positions need to be calculated separately using orbital ephemerides. OwnStarMap maps focus on the fixed stars; planet overlays may be added as an optional layer in future versions. The Moon, if it was visible, is generally indicated only by its symbol if requested.
Does the algorithm account for atmospheric effects?
The astronomical calculation is for the geometric position of each star above the horizon. Atmospheric extinction (stars dimming near the horizon) is not simulated visually — the printed map represents the geometric sky, not how it would appear to a human eye dealing with haze and light pollution.
Does the algorithm account for precession?
Yes. The IAU 2006 precession-nutation model is used to compute the position of each star at the user's chosen date, not just at the catalog's epoch (J2000.0). For dates centuries from now or centuries ago, this matters — the constellations slowly drift over millennia.
How long does it take to generate one star map?
Server-side, the calculation runs in 1–2 seconds. The bulk of the response time is rendering the high-resolution image. End-to-end, from clicking "generate" to receiving the PDF, is usually under 30 seconds.
Make It
The pipeline above is what runs behind every OwnStarMap order — no artistic shortcuts, no decorative dots, no fake stars. Every point on your print corresponds to a real star that was genuinely overhead at the moment you chose. When you're ready to see it work on a date that matters to you, open the configurator. For the deeper algorithmic story, our algorithm guide goes one level into the math.
Ready to capture your special moment?
Create a personalized star map in minutes.
Design my Star Map — from 12,00 €